How a Continuous Emission Monitoring System Works: From Stack Measurement to Emissions Data
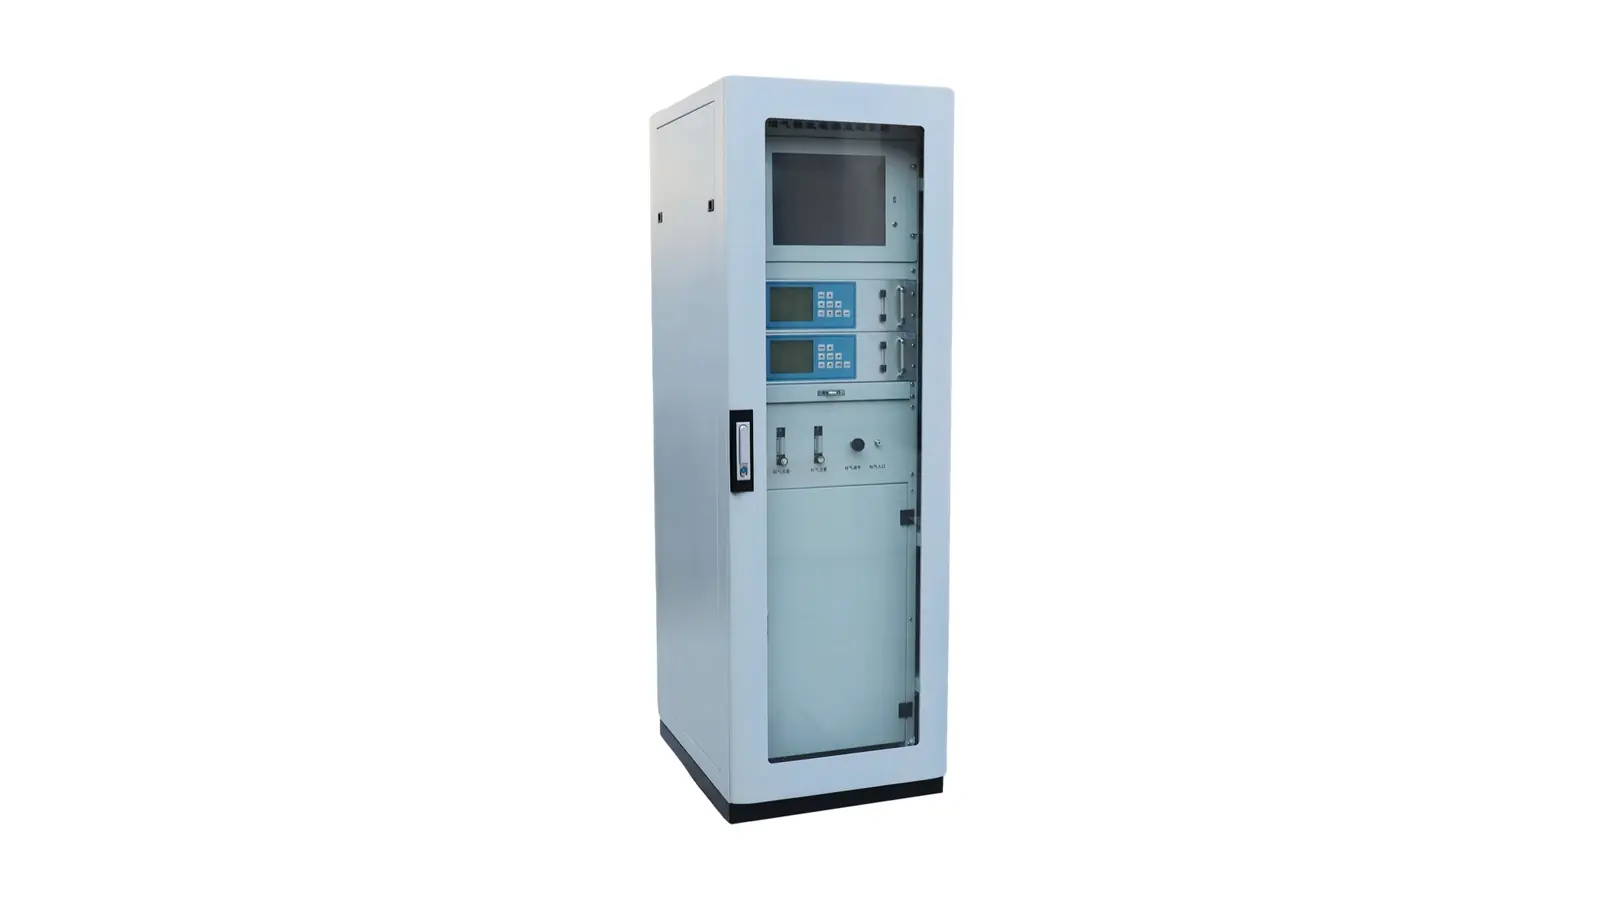
A continuous emission monitoring system (CEMS) measures selected pollutants and associated stack parameters, then records and processes those measurements into emissions information. Measurements may come from gas extracted from the stack or instruments operating directly in the gas stream. Reliable results depend on the complete chain: representative measurement, appropriate sample handling, suitable instruments, and data processing that preserves the meaning and status of each result.
Huisheng lists gas, particulate, stack-parameter and data-processing subsystems within its CEMS product scope. The configuration depends on the monitoring task; a parameter listed in a product family is not necessarily included in every supplied system.
What Does a CEMS Measure?
Pollutants and Supporting Stack Parameters
The monitoring task determines which pollutants a CEMS measures. Depending on the application, these may include gases such as sulfur dioxide (SO₂), nitrogen oxides (NOₓ) or carbon monoxide (CO), and particulate matter.
Supporting measurements can include oxygen, moisture, temperature, pressure and flow. These values serve different purposes. Gas concentration may be expressed as an amount fraction, such as parts per million by volume (ppmv), or as mass per unit gas volume. Flow information can support calculation of the mass released over time.
Oxygen and moisture measurements may also be needed to express results on the required reporting basis. They should not be treated as interchangeable with pollutant measurements or assumed necessary in the same configuration for every application.
Why a CEMS Is More Than a Gas Analyzer
A gas analyzer measures particular constituents. A complete CEMS also needs the measurement interface and data functions required for its task. A gas analyzer does not automatically measure dust, flow or moisture simply because it is installed in a CEMS cabinet.
Huisheng’s continuous emission monitoring system page separates these functions into subsystems. This illustrates why the system scope must be checked beyond the analyzer name: the required result depends on how the instruments and data functions work together.
How Does a CEMS Obtain a Representative Measurement?
Extractive Measurement: Taking a Sample from the Stack
An extractive system takes gas through a probe and transports it to an analyzer. The sample must represent the gas stream being assessed. An accessible port does not, by itself, establish a representative measurement location. Uneven flow or concentration profiles can make a local reading differ from conditions elsewhere in the stack.
A stable analyzer display cannot correct an unrepresentative sample. The measurement location therefore has to be assessed against the applicable method and actual stack conditions, rather than selected solely for installation convenience.
In-Situ Measurement: Measuring Within the Gas Stream
An in-situ instrument measures at a point in the stack or along a path across it. This avoids transporting a gas sample to a remote analyzer, although suitable positioning, calibration arrangements and maintenance remain necessary.
Point and path measurements sample the gas differently. Neither arrangement automatically eliminates errors caused by an unsuitable location. The distinction concerns how the measurement is obtained, not whether one arrangement is universally more accurate.
What Happens to an Extracted Gas Sample Before Analysis?
Transporting the Sample Without Losing the Target Compounds
Sample transport must preserve the constituents being measured. Condensation, adsorption onto surfaces, leaks or unstable sample flow can alter what reaches the analyzer. An apparently functioning instrument may then measure a changed sample rather than the original stack gas.
The sampling line is therefore part of the measurement chain. Its temperature control, materials and connections have to suit the target compounds and gas conditions. Heating can prevent unwanted condensation in a specified sample path, but the required temperature cannot be chosen as a universal setting for every CEMS.
Matching Conditioning to the Measurement Method
Extractive systems may use hot-wet, cool-dry or dilution arrangements:
| Arrangement | Basic sample-handling approach |
|---|---|
| Hot-wet | Keeps the sample heated and retains water vapor |
| Cool-dry | Cools the sample and removes moisture before analysis |
| Dilution | Mixes the sample with a controlled dilution stream |
These are different approaches, not mandatory consecutive stages.
Conditioning must control interference without unintentionally removing the target pollutant. Cooling and drying can be unsuitable if the resulting condensate removes a compound that must be measured. The question is not simply whether the gas is clean and dry, but whether the delivered sample remains suitable for the selected measurement method.
How Do Analyzers and Stack Instruments Produce Measurements?
Measuring Gas Concentrations
A gas analyzer converts a response associated with the target gas into a concentration using its measurement model and calibration. Optical analyzers, for example, can use gas absorption at selected wavelengths. Different gases require appropriate measurement channels and methods; one measurement principle should not be assumed to cover every listed compound.
The response must be interpreted within the instrument’s specified range and sample conditions. A numerical result alone does not show whether interference, unsuitable conditions or an instrument fault has affected it.
Measuring Particulate Matter and Stack Conditions
A particulate monitor uses a particle-sensitive measurement method and the calibration or correlation procedure required for its application. Its result is not derived from the gas analyzer’s SO₂ or NOₓ reading.
Stack-condition instruments provide separate inputs. Gas velocity, for example, is not itself volumetric flow: converting velocity into a flow rate requires the relevant stack area and measurement treatment.
Huisheng’s temperature, pressure and flow monitoring product provides an example of this supporting instrument role. Its presence in the product range does not mean the same device or configuration is mandatory for every project.
How Are Measurements Turned into Emissions Data?
Recording Signals, Timestamps, and Operating Status
The data system associates instrument outputs with their parameter, time and operating status. This allows a recorded value to be interpreted as a pollutant measurement, a calibration response or a reading affected by a fault.
Receiving a signal is only the beginning. The system must preserve what that signal represents so that later calculations and reports use the appropriate measurements.
Distinguishing Concentration from Emission Rate
Concentration and emission rate answer different questions. Concentration describes the proportion of a pollutant in the gas or its mass per gas volume. A mass emission rate describes the mass released per unit of time.
Where mass concentration and volumetric flow refer to matching gas conditions and corresponding time periods, their product gives a mass emission rate, with the necessary unit conversion.
This relationship does not justify multiplying a raw analyzer reading by any available flow value. A concentration in ppmv requires an appropriate conversion before it can be used as a mass concentration. The concentration and flow must also refer to compatible conditions. A documented EPA-hosted CEMS plan illustrates this distinction by pairing mass concentration with flow on the same dry, standard-volume basis.
Keeping the Reporting Basis Consistent
Gas volume changes with temperature, pressure and water content. Results expressed at actual and reference conditions, or on wet and dry bases, therefore cannot be combined without the relevant conversion.
An oxygen-corrected concentration also serves a different reporting purpose from an uncorrected concentration. It should not simply be multiplied by an uncorrected flow to calculate mass emissions.
The reporting requirement determines which conversions and averages are appropriate. No single reference oxygen value, temperature or averaging period applies to every installation. A useful emissions record retains the units, basis and processing context needed to interpret the result. EPA training material likewise identifies the need to reconcile wet- and dry-basis measurements before comparison.
How Do Calibration and Quality Checks Keep the Data Usable?
Checking Measurement Performance
Calibration and quality checks help establish whether measurements remain within the performance expected for the application. A check at the analyzer and a check involving the sampling path address different parts of the measurement chain. The required approach depends on the instrument, system design and applicable method.
Performance assessment after installation and ongoing quality assurance serve different purposes. A system that worked at commissioning still requires the checks and maintenance appropriate to its service. EPA’s CEMS guidance distinguishes initial performance evaluation from procedures used to assess data quality during operation.
Separating Valid Measurements from Calibration and Fault Periods
During calibration, an analyzer may be measuring a reference gas rather than stack gas. During a fault or maintenance period, a recorded value may not be suitable as a normal emissions measurement.
These periods need identifiable status and treatment under the applicable data rules. They should not automatically be counted as valid stack results or replaced with zero emissions.
A working CEMS connects physical measurement with interpretable records. For a project discussion, contact Huisheng with the target parameters, stack conditions, intended use of the data and applicable requirements. These details help define the instruments, sample path and data functions needed for the monitoring task.